Project Overview
The Tamil Nadu Heat Mitigation Strategy outlines a comprehensive approach to address rising heat risks due to climate change and urbanization. It emphasizes early warning systems, urban planning reforms, and nature-based solutions. The Heat Hazard and Vulnerability Profile identifies high-risk districts and vulnerable populations—such as the elderly, outdoor workers, and low-income communities—based on temperature trends, socio-economic indicators, and urban heat island effects. The strategy calls for localized heat action plans, improved public awareness, and infrastructure upgrades to enhance resilience and reduce heat-related health impacts.
Project Details
Organization:
World Resources Institute
Role:
Program Associate
Duration:
Dec 2023 - May 2024
Tools Used:
- QGIS
- Google Earth Engine
My Contributions:
- Developed a comprehensive heat hazard profile for Tamil Nadu using multi-source datasets including Land Surface Temperature (LST), air temperature, and projected climate data.
- Calculated Universal Thermal Climate Index (UTCI) to assess thermal stress across urban and rural regions, supporting climate-resilient planning.
- Conducted spatiotemporal analysis of vegetation change over the past 20 years using Normalized Difference Vegetation Index (NDVI) trends to understand the role of green cover in heat mitigation.
- Identified vulnerable populations by integrating demographic data with heat exposure layers, highlighting high-risk zones for targeted interventions.
Impact Summary:
This work formed the scientific foundation for Tamil Nadu’s statewide heat mitigation strategy, enabling data-driven decision making for urban planning, public health, and climate adaptation. The outputs were used to inform policy briefs, stakeholder workshops, and inter-departmental coordination.
Selected Visuals
Showcase key maps, charts, or images that illustrate your project's process and results.
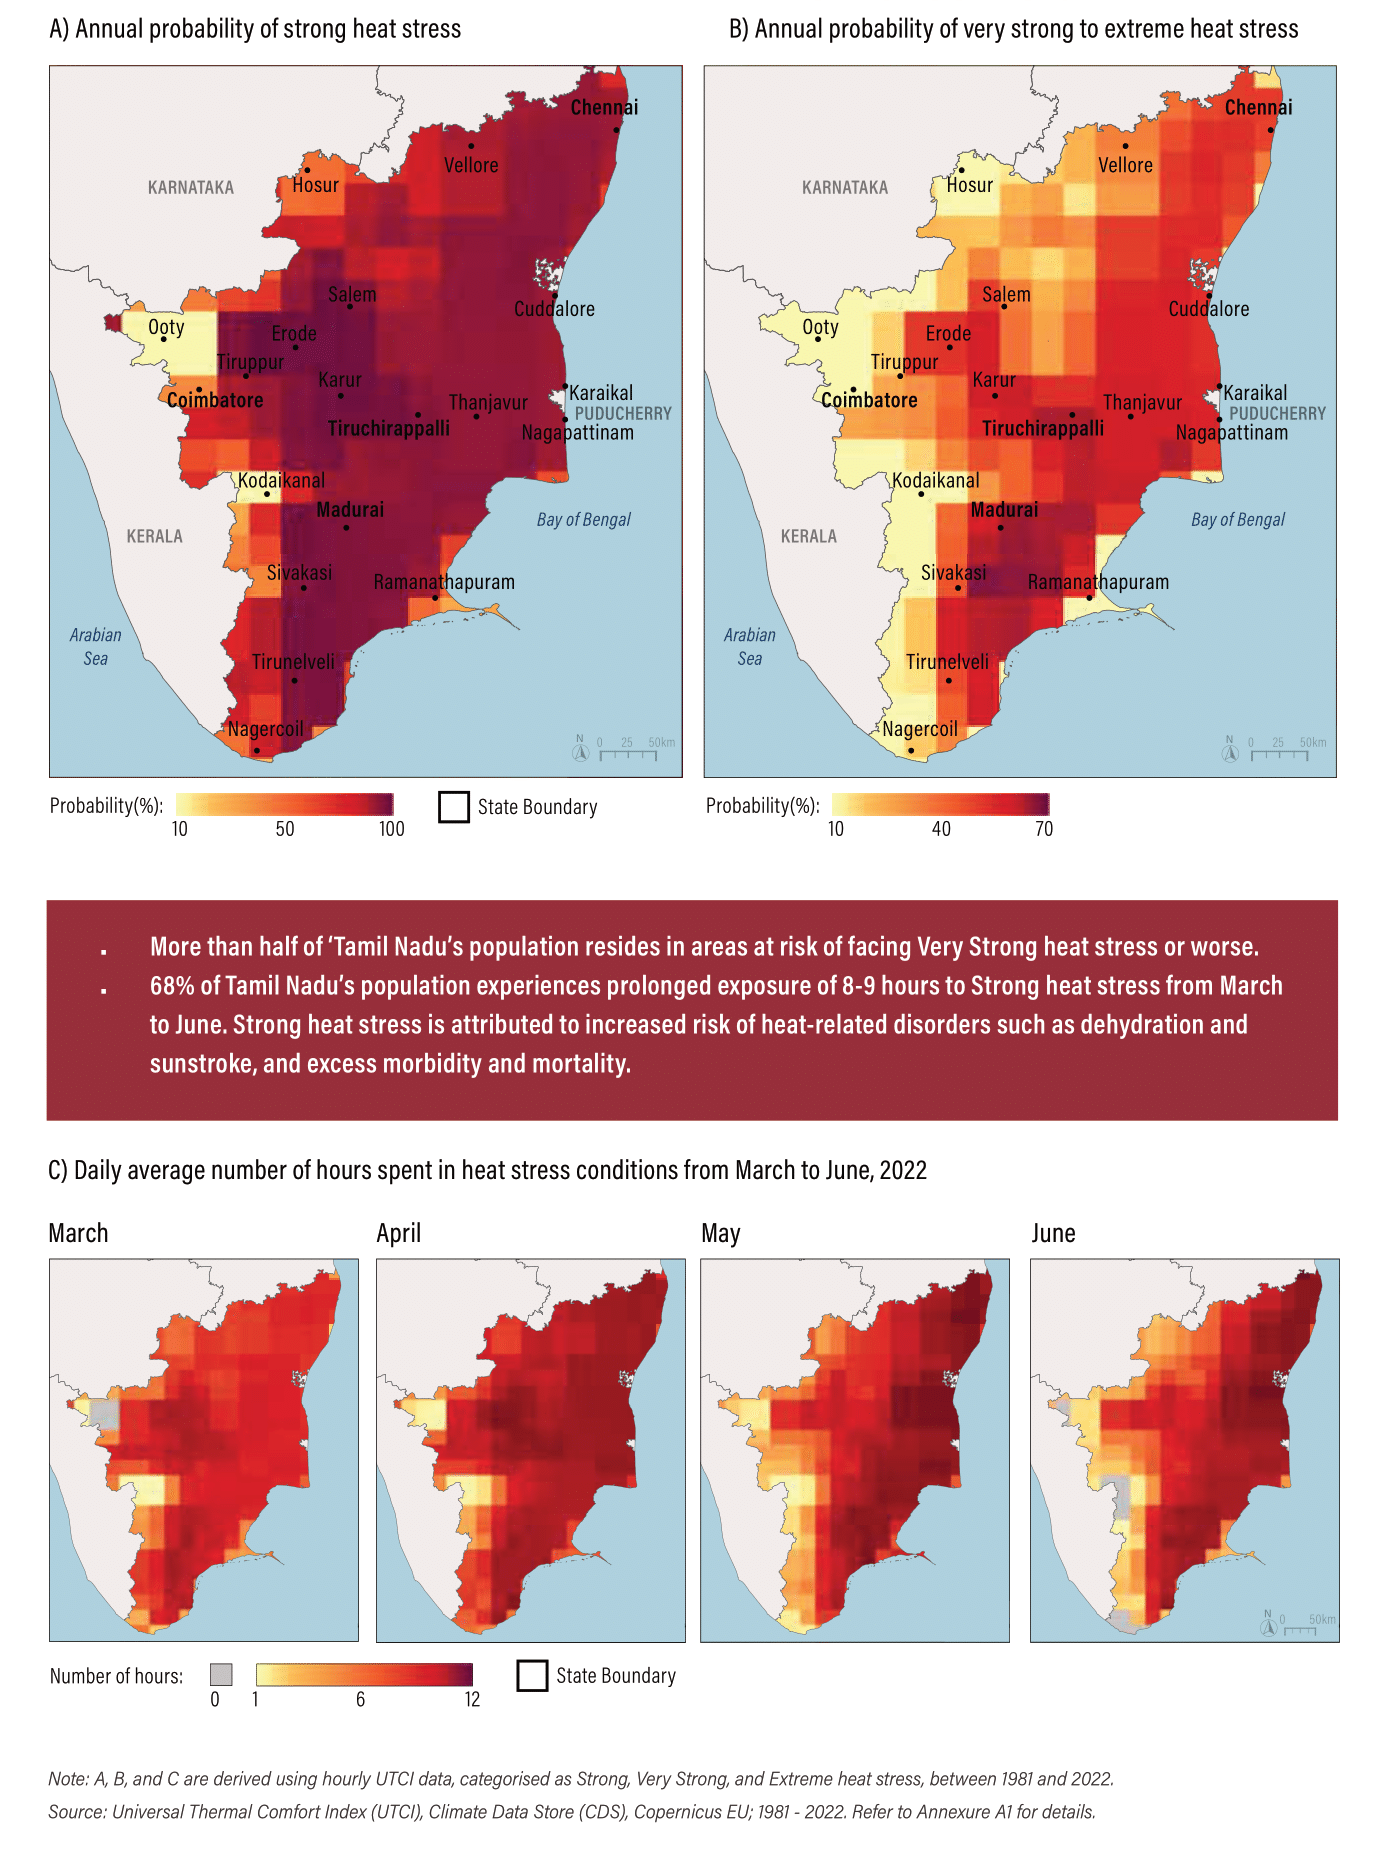
Spatio-temporal patterns in heat stress across Chennai and other major cities in Tamil Nadu, India using Universal Thermal Comfort Index (UTCI) processed using Google Earth Engine and visualization using QGIS
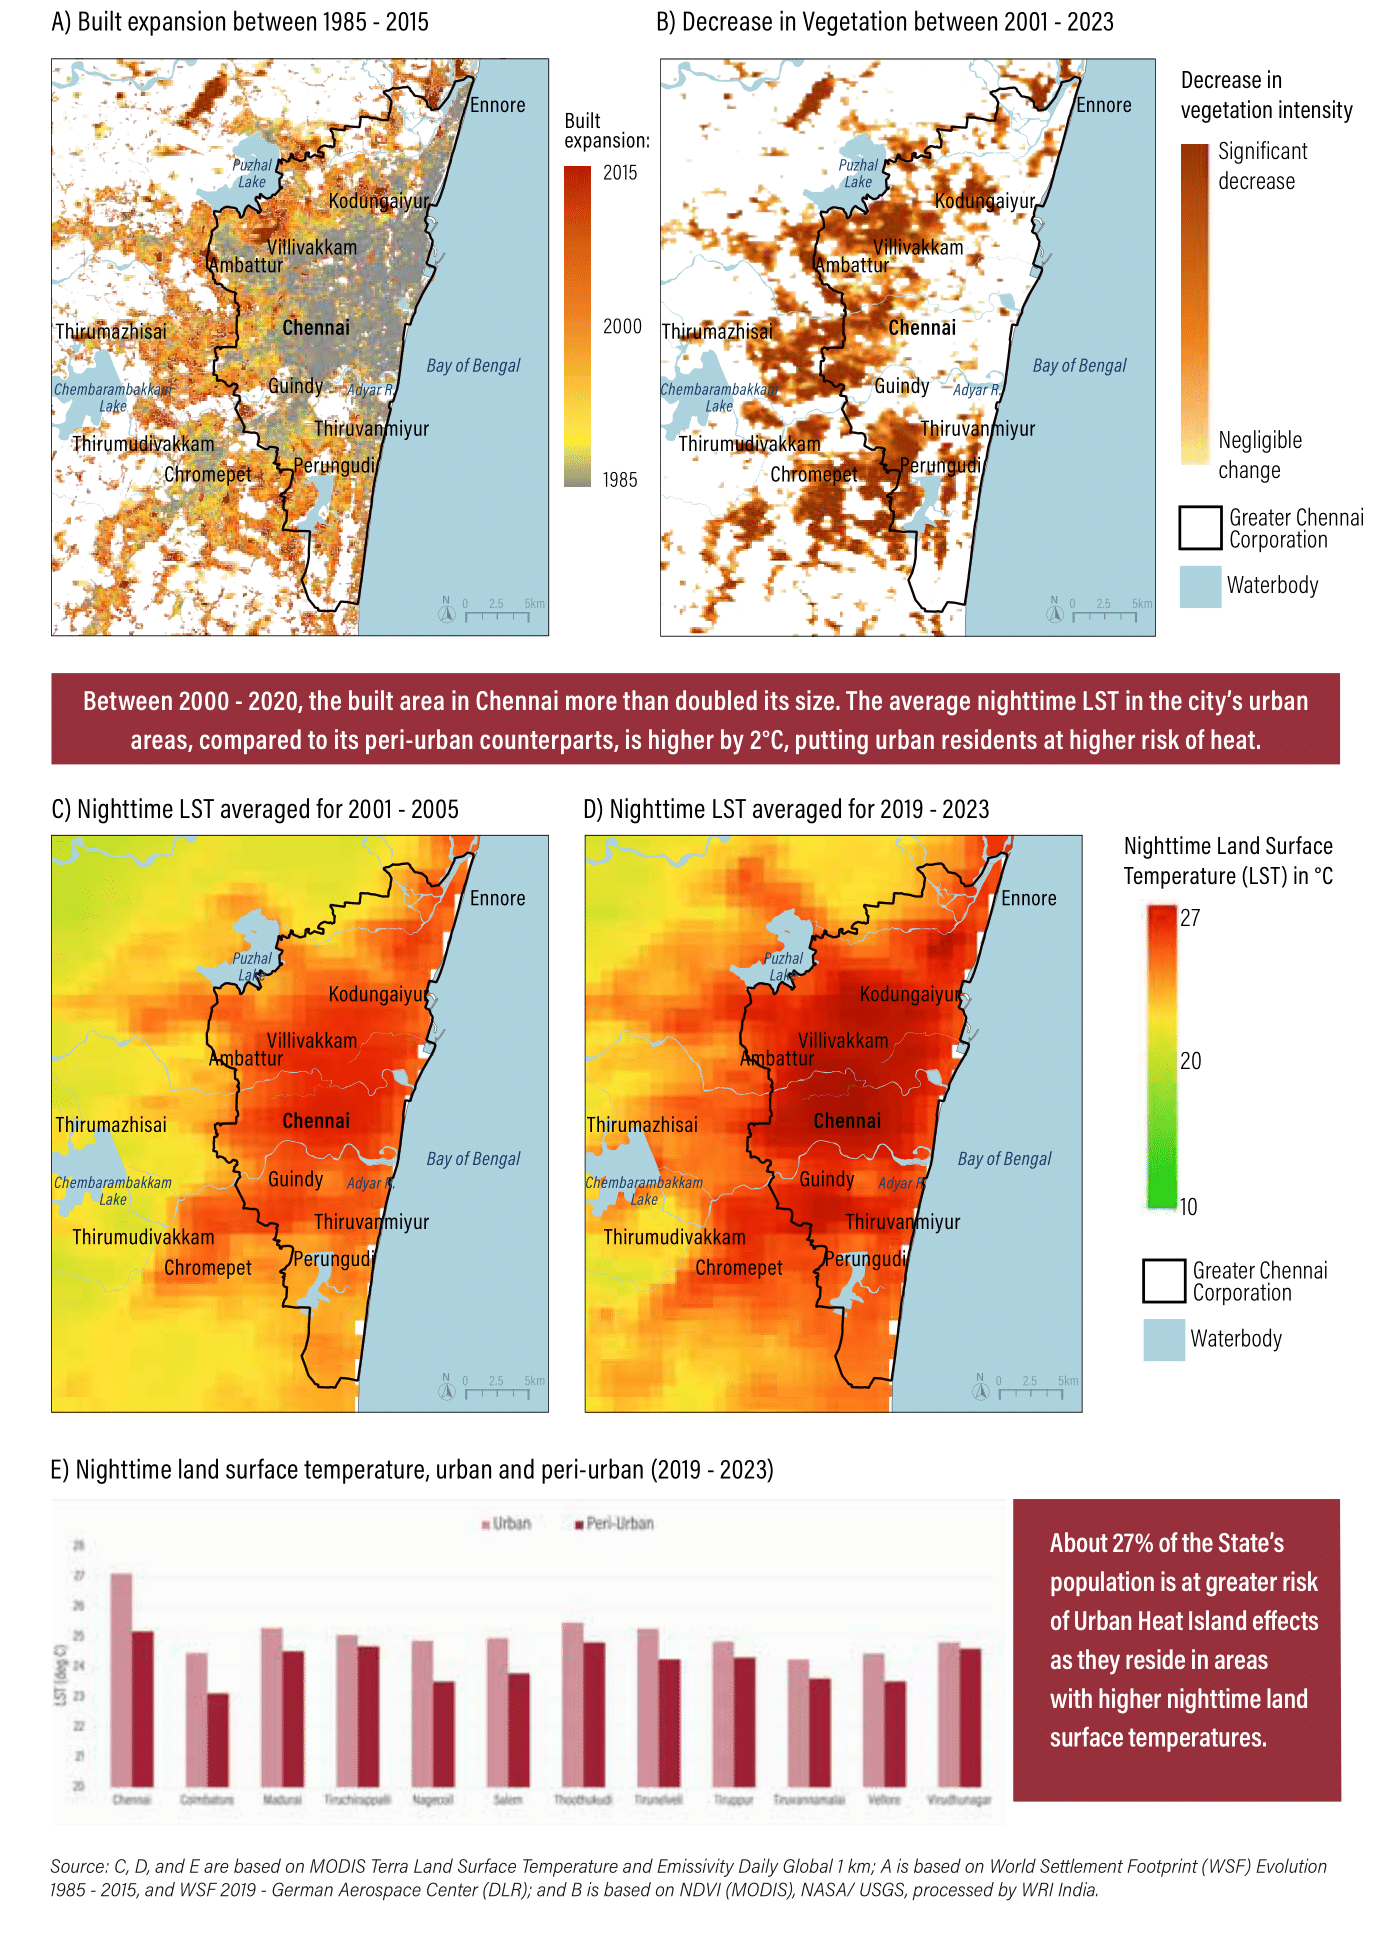
Land surface temperature patterns across Chennai and other major cities in Tamil Nadu, India analyzed and processed using MODIS NDVI and LST in Google Earth Engine and visualizations using MS Excel and QGIS